In this activity we were to use Principal Component Analysis (PCA) in image reconstruction. PCA is a mathematical procedure that utilizes the orthogonal transformation to transform a set of possibly correlated variables into a smaller set of linearly uncorrelated variables which are called principal components. The principal components are ordered such that the first PC accounts for the highest variability in the data and each succeeding component has a higher variability than the next.
In Scilab 5.4.1, the PCA can be performed by calling the pca(x) function. The output of the function is separated into three matrixes depending upon the variable names given. Following the default given by the demo, we shall call them lambda, facpr, and comprinc. The input x is an n x p matrix wherein there are n observations with p components. The outputs lambda is a p x 2 matrix where the first column contains the correlation, and the second column contains the percentage variability of the PC. The facpr contains the principal components, or the eigenvalues, while comprinc contains the projections of each observation towards the PC. In this activity, the components for reconstruction is encased in the facpr matrix.
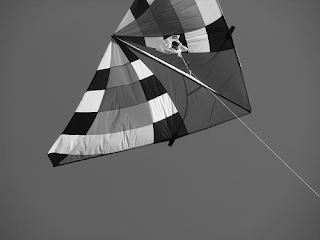
In order to perform the image compression, a template has to be set such that the image can be reconstructed. Thus in this activity the image shown below was used. Both are already scaled images, the first a 500 x 375 image while the second is a 510 x 248 image. The image is then partitioned into individual 10 x 10 blocks to act as the individual observations. With the observations to be in vector form, the 10 x 10 blocks were concatenated into 1 x 100 matrices and all observations were contained in the r*c x 100 matrix x, where r and c are the dimensions of the image. The principal components were thus calculated by using the pca() function.
Using the cumsum() function upon the second column in lambda, I can tell the degree of reconstruction done by using the combined weighted eigenimages in facpr. The weight themselves are computed as the scalar dot multiplication of the concatenated 10 x 10 image block and the corresponding eigenimage. As can be seen, the method implied works best for a 2D image, as such this was tested on the grayscale image of the kite.
The eigenimages and their corresponding weights were calculated as discussed earlier. The images were reconstructed from least (72%) to greatest (100%) in iterations of 4%. The minimum reconstruction will inevitably depend the highest variability of the eigenimages. As can be seen with the images below.
For size comparison refer to the table shown below, the size of the image cropped to the same size as the reconstructed image is 92.1 kB.
As can be seen, image size decreases between 92% to 96% reconstruction, but my take on this is that at the 92% percent reconstruction, pixelation of the image decreased which could have decreased the data load in the matrix. With that an image reconstruction has been performed on a grayscale image. On a colored image though this can be done by performing the reconstruction per color channel and combining the results in order to form the RGB image.
Due to the compresion, the 96% reconstruction looks similar to the 100% reconstruction. Again as shown in the table below, the image size decreases correspondingly to the percentage of reconstruction. Size of the original image cropped to the same dimensions is 456 kB.
In this activity I give myself a grade of 11 for being able to complete the activity and for being able to to the method on a colored image.


No comments:
Post a Comment